
Ready to Get Started?
Send us information on you, your company and your project. One of our experts will respond as soon as possible.

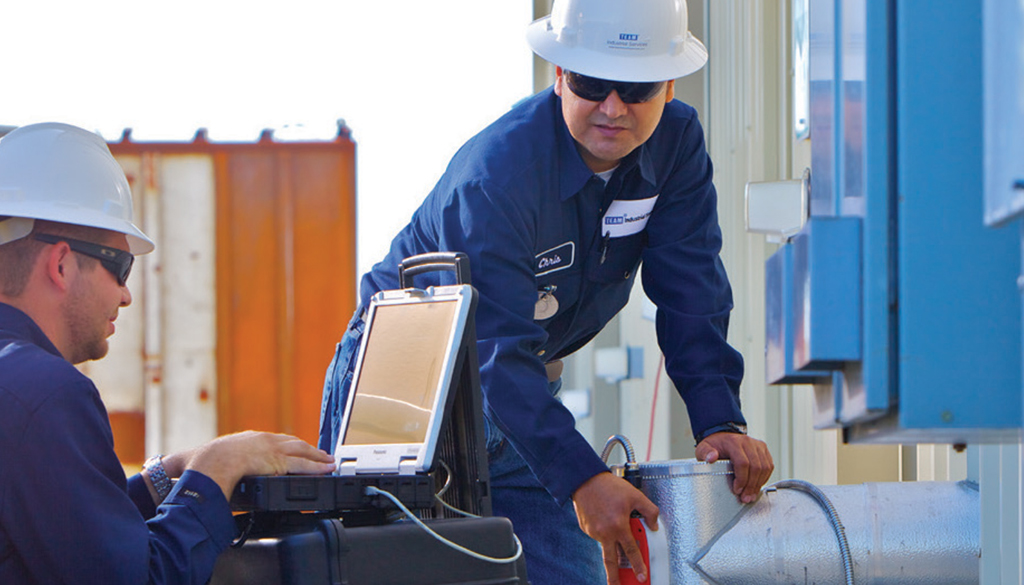
Fugitive emissions, unfortunately, come with the territory for most refineries, chemical plants, and natural gas facilities. Playing whack-a-mole with leaking valves, degrading seals, and flanges worn by decades of pressure changes is unavoidable, but you can control how quickly, accurately, and consistently you find those leaks.
It’s better for the environment, simplifies regulatory compliance, and can often increase productivity. But there’s a catch: the strongest programs don’t choose just one LDAR detection approach.
The EPA recognizes two primary detection technologies for LDAR compliance: Method 21 and Optical Gas Imaging. A third approach, Quantitative OGI, is emerging as an increasingly important complement to both. Each has distinct strengths and real limitations. Facilities with the strongest emissions programs have learned that picking one and calling it done is where compliance gaps start.
Where to start? Let’s get into it.
The tried-and-true foundation of industrial LDAR since the EPA standardized it in the 1970s, Method 21 is the meat and potatoes of leak detection and repair. It’s straightforward and effective: a technician places a portable organic vapor analyzer (a flame ionization detector (FID) or photoionization detector (PID).) directly against each regulated component and records the reading against the applicable leak threshold, typically 500 to 10,000 ppm depending on the governing standard.
Method 21’s strength is its component-level precision. It produces a quantified concentration reading for each individual valve, pump seal, connector, and flange. That granularity makes it the required approach for many regulatory standards and the default method when a facility needs to confirm whether a specific component meets its leak-definition threshold.
The biggest limitation of Method 21 is scale. A medium-sized petroleum refinery can have 250,000 regulated components, each requiring individual measurement one to four times per year. This translates to up to one million leak checks annually at a single facility. The process is labor-intensive, time-consuming, and sensitive to environmental conditions.
Across long inspection campaigns, Method 21 can slow detection frequency in ways that allow larger leaks to persist between cycles.
When the goal is confirmed component-level leak thresholds, regulatory demonstration, or compliance with standards that specifically require it. It’s also required as a follow-up verification method under many Alternative Work Practice frameworks, even when OGI is the primary survey method.
The EPA formalized OGI technology in 2008 through the Alternative Work Practice rule, which for the first time allowed infrared cameras to substitute for Method 21 instruments in certain regulatory contexts.
The underlying technology uses infrared spectral absorption principles. Hydrocarbon gases absorb or emit IR photons in ways that make otherwise invisible plumes appear as a visible stream on camera.
Where Method 21 requires a technician to make physical contact with each component one by one, a single OGI operator can survey an entire process unit from a safe distance, visualizing emissions across hundreds of components in the time it would take Method 21 to cover a fraction of that ground.
Research from EPA stakeholder workshops confirmed that OGI’s faster survey pace allows higher inspection frequency, and that the smaller leaks OGI may miss are more than offset by faster identification and repair of larger leaks when surveys happen more often.
This matters most because of a prevalent industry distribution problem. The larget 5% of leaks account for approximately 50% of total fugitive emissions at oil and gas facilities. OGI is built to quickly find large super-emitters before they compound. While a quarterly Method 21 program can miss a super-emitting event if it develops between cycles, OGI programs find it faster.
Environmental conditions, operator experience, imaging distance, and gas composition affect OGI detection performance. The technology produces a visual plume (qualitative confirmation that something is leaking) but not a measurement of how much. It’s a critical gap that matters for reporting, prioritizing repairs, and increasingly for emissions quantification.
OGI excels for wide-area surveys, high-frequency inspection campaigns, and rapid identification of large leaks. It’s the right primary tool when coverage and speed matter — particularly on large component populations where Method 21 alone would require so much time per inspection cycle that frequency suffers.
Quantitative OGI takes the visualization capability of standard OGI and adds emission rate measurement directly to the field workflow. The EPA’s own Science Inventory describes QOGI as providing information beyond simple leak discovery. This specifically refers to the measurement or estimation of emission rates using OGI systems, and identifies it as an actively developing technology area.
In practical terms, QOGI allows a technician to capture not just that a valve is leaking, but how much. With GPS-tagged, timestamped data that flows directly into regulatory reporting without manual calculation steps. That level of field documentation transforms an OGI survey from a detection event into a compliance record.
The implications for reporting confidence are substantial. Under the EPA’s OOOOb methane rule and the EU Methane Regulation’s equivalent MRV requirements, operators increasingly need to demonstrate not just that they surveyed for leaks, but that their reported emissions figures reflect what was actually measured in the field. Qualitative OGI shows you a plume. QOGI hands you a number you can put in an inventory with confidence.
QOGI is the right tool when emissions quantification is the goal for GHG inventory development, regulatory submissions under Subpart W, OGMP 2.0 reporting, or any context where a verified emission rate matters more than visual confirmation alone.
As an EPA case study data demonstrates, LDAR effectiveness ranges from 30% to 97% depending on inspection frequency, detection method, and repair timelines. There’s no single type of LDAR testing that delivers 97%. Programs that reach this level of accuracy require multiple methods in combination, matched to asset type, regulatory context, and reporting requirements.
TEAM’s detection services are built to integrate each method when it matters most. LDAR programs structured around both Method 21 and OGI compliance requirements, optical gas imaging surveys that include QOGI-capable quantification where reporting demands it, and greenhouse gas control and methane emissions reduction solutions that connect detection directly to repair without changing vendors. Every finding is documented in OneInsight® — GPS-tagged, timestamped, audit-ready.
TEAM Inc. is available 24 hours a day, 7 days a week, 365 days a year to provide the support you need whenever you need it.
Call the Emergency HotlineSend us information on you, your company and your project. One of our experts will respond as soon as possible.